Background
The cell membrane functions as a barrier and a gateway. It keeps enzymes, DNA, and metabolic pathways in one bundle while at the same time, discharges waste products and allows essential materials such as water to enter through it. The term "semipermeable" is used to describe a membrane that allows some molecules to pass through while blocking the passage of others. Molecules pass through the cell membrane by processes that require the cell to expend energy (known as active transport) or by processes driven by kinetic energy of molecules (known as passive transport).
In these experiments, we investigated the passage of materials through a semipermeable membrane by passive transport. This tubing allows larger molecules to pass through, but slowly.
The movement of molecules from areas of higher concentration to areas of lower concentration is called diffusion. Osmosis is the diffusion of water molecules across a semipermeable membrane.
When the concentration levels of two solutions on either sides of the membrane are equal and no movement is detected, the solutions are isotonic. This means that the solutions have the same concentration of solutes. If two solutions differ in the concentration of solutes that each has, the one with more solute is hypertonic. The solution that has less solute is hypotonic.
Problem: How does solute concentration affect the rate of osmosis?
Hypothesis: If the environment is isotonic, then there is no net movement occurring.
Hypothesis: If the environment is isotonic, then there is no net movement occurring.
Lab 1A
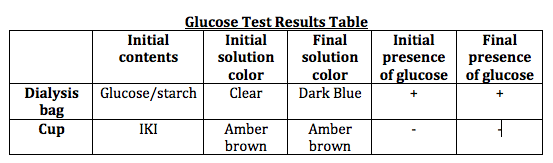
Prediction: The solution is hypertonic. The solution is iodine, while what is inside of the dialysis bag glucose solution. Since the solution is hypertonic, we predict some iodine will go into the bag for balancing purposes. The bag will expand a bit and the color of glucose solution will change because when glucose reacts with iodine, its color changes into dark blue.
Materials: Dialysis tubing, plastic cups, glucose/starch solution, distilled water, iodine-potassium iodide (IKI) solution, dropping pipet, glucose test strips, funnel
Procedure
1) Pour 160 to 170 mL of distilled water into a plastic cup. Add about 4 mL of IKI solution to the water and mix well. Record the initial solution color. Dip a glucose test strip into the solution and record the initial glucose test result. Then discard the glucose test strip.
2) Dip another glucose test strip, this time into the glucose/starch solution. Record the initial results. Then discard the used glucose test strip.
3) Obtain a piece of dialysis tubing that has been soaked in water. The tubing should be soft and pliable. To open the tubing, roll the index finger and thumb to open it. Close one end of the tube by knotting it or tying it off with string. This will form a bag.
4) Use a small funnel, pour 15 mL of glucose/starch solution in the dialysis bag. Smooth out the top of the bag, running it between the thumb and index finger to expel air. Tie the open end of the bag. Leave some room in the bag to allow expansion. Record the initial color of the glucose/starch solution.
5) Immerse the dialysis bag in the solution in the cup. Make sure that the portion of the bag that contains the glucose/starch solution is completely covered by the solution in the cup at all times.
6) Wait for 20 minutes.
7) After 20 minutes, remove the bag from the cup, blot it on paper towel, and cut a slit in the bag large enough to insert a glucose test strip. Record results.
RESULTS
Analysis of Results
1) No, there are no conflicts. Our prediction was just like our results.
2) No, this activity does not account for the diffusion of all the molecules in my predictions. I would measure the initial and final mass of the bag and iodine solution to show the net direction of diffusion.
3) The data showed that starch molecules must be bigger than the pores while IKI molecules were smaller than the pores.
Lab 1B
Materials: Dialysis tubing, plastic cups, distilled water, funnel, sucrose solutions, paper towels, balance
1) Pour 160 to 170 mL of distilled water into a plastic cup. Label the cup with the concentration of the sucrose that will be tested.
2) Obtain a piece of dialysis tubing that has been soaked in water. The tubing should be soft and pliable. Roll the tubing between the thumb and index finger to open it. Close one end of the tube by knotting it or tying it with a string. This will form a bag.
3) Using a small funnel, pour 15 mL of sucrose solution into the dialysis bag. Smooth out the top of the bag, running it between the thumb and the index finger to expel the air. Tie the open end of the bag. Leave some room in the bag to allow expansion.
4) Dry the bag on paper towels and then find its mass. Record this as the initial mass.
5) Immerse the dialysis bag in the water in the cup. Make sure that the portion of the bag containing the sucrose solution is covered by the water in the cup completely at all times. Wait for a day.
5) After a day, remove the bag from the cup and dry it on paper towels. Mass the bag and record the final mass.
6) Determine the change of mass.
Results
The more substance there is in the bag, the more water will enter into the bag, resulting a bigger change in mass.
Analysis of Results
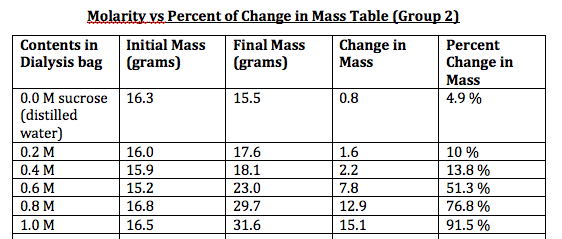
1) equation used to calculate the percent change in mass: % change in mass = Change in mass/Initial Mass x 100
0.0 M : (15.5 - 16.3)/16.3 x 100 = 4.9
0.2 M : (17.6 - 16.0)/16.0 x 100 = 10
0.4 M : (18.1 - 15.9)/15.9 x 100 = 13.8
0.6 M : (23.0 - 15.2)/15.2 x 100 = 51.3
0.8 M : (29.7 - 16.8)/16.8 x 100 = 76.8
1.0 M : (31.6 - 16.5)/16.5 x 100 = 91.5
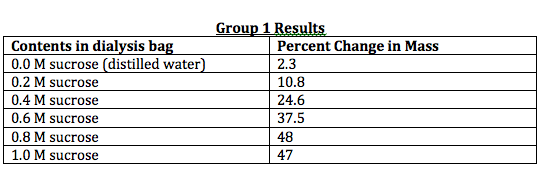
2) Equation used to get the class average:
CLASS AVG. = (Group 1 percent change mass + Group 2 (my group) percent change mass)/2
0.0 M : (4.9 + 2.3)/2 = 3.6
0.2 M : (10 + 10.8)/2 = 10.4
0.4 M : (13.8 + 24.6)/2 = 19.2
0.6 M : (51.3 + 37.5)/2 = 44.4
0.8 M : (76.8 + 48)/2 = 62.4
1.0 M : (91.5 + 47)/2 = 69.3
CLASS AVG. = (Group 1 percent change mass + Group 2 (my group) percent change mass)/2
0.0 M : (4.9 + 2.3)/2 = 3.6
0.2 M : (10 + 10.8)/2 = 10.4
0.4 M : (13.8 + 24.6)/2 = 19.2
0.6 M : (51.3 + 37.5)/2 = 44.4
0.8 M : (76.8 + 48)/2 = 62.4
1.0 M : (91.5 + 47)/2 = 69.3
3) Change of mass indicates whether some water has went into the bag or out of the dialysis bag.
4) A hypothesis that this experiment is designed to test: If there is no substance in the dialysis bag, then water will not go into the bag because water follows higher concentrations of "salts".
5) The variable being tested in this experiment is the molarity or concentration of sucrose in the dialysis bag.
6) Three variables that could influence the outcome of this experiment are temperature (the higher the temperature, the faster the movement of water molecules across the semi-permeable membrane), light (the brighter the light, the faster osmosis takes place), and the surface area of the holes of the bag (the smaller the area, the slower the movements of water molecules). All of the bags were at room temperature and room light, and we used the same type of dialysis bags.
7) a. The independent variable is "concentration of sucrose"
b. The dependent variable is "percent of change in mass"
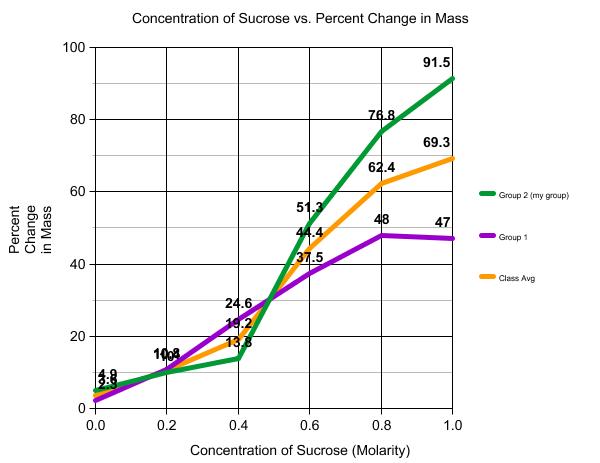
8) My group's line trends are the same as the class average (both lines are going down), but my group started off with a higher percent of change in mass.
9) Yes, this experiment has adequately tested the variable I listed under question number 5.
10) Yes, my results support my hypothesis, except the results from the bag with 1.0 M of sucrose outside the bag. What was suppose to happen was no to very little change in mass. It may be because of our error (we only added 99 mL of 1.0 M sucrose due to measuring errors). It is suppose to be isotonic.
11) As the amount of solute in the environment increases, the amount of water in the cell moves out.
12) The dialysis bag with 0.0 M of sucrose outside of the bag (the control group) was isotonic.
13) If only distilled water filled the dialysis bag and the sucrose solution was used to fill the cup, the results would have changed dramatically. Water will just leave from the dialysis bag because of the hypertonic environment, resulting a negative percent change in mass.
14) Drinking seawater dehydrates the body because water follows salt. When you drink seawater, your body's solution is hypertonic. The cells' water will leave the cell to balance out the concentration levels of salt in your body.
4) A hypothesis that this experiment is designed to test: If there is no substance in the dialysis bag, then water will not go into the bag because water follows higher concentrations of "salts".
5) The variable being tested in this experiment is the molarity or concentration of sucrose in the dialysis bag.
6) Three variables that could influence the outcome of this experiment are temperature (the higher the temperature, the faster the movement of water molecules across the semi-permeable membrane), light (the brighter the light, the faster osmosis takes place), and the surface area of the holes of the bag (the smaller the area, the slower the movements of water molecules). All of the bags were at room temperature and room light, and we used the same type of dialysis bags.
7) a. The independent variable is "concentration of sucrose"
b. The dependent variable is "percent of change in mass"
8) My group's line trends are the same as the class average (both lines are going down), but my group started off with a higher percent of change in mass.
9) Yes, this experiment has adequately tested the variable I listed under question number 5.
10) Yes, my results support my hypothesis, except the results from the bag with 1.0 M of sucrose outside the bag. What was suppose to happen was no to very little change in mass. It may be because of our error (we only added 99 mL of 1.0 M sucrose due to measuring errors). It is suppose to be isotonic.
11) As the amount of solute in the environment increases, the amount of water in the cell moves out.
12) The dialysis bag with 0.0 M of sucrose outside of the bag (the control group) was isotonic.
13) If only distilled water filled the dialysis bag and the sucrose solution was used to fill the cup, the results would have changed dramatically. Water will just leave from the dialysis bag because of the hypertonic environment, resulting a negative percent change in mass.
14) Drinking seawater dehydrates the body because water follows salt. When you drink seawater, your body's solution is hypertonic. The cells' water will leave the cell to balance out the concentration levels of salt in your body.
Conclusion
The purpose of the lab was to test out osmosis. No, my results did not exactly support my hypothesis because the bag with 0.0 M of sucrose should have a change of mass of 0, but instead, there was still a change in mass (4.9%). What can be concluded from this lab though, is water does follow higher concentration of "salts" for balance purposes. As shown in the graph, the more substance there is in the bag, the more water will go into the bag, resulting a bigger change in mass. Several errors that have or may have occurred in this experiment are 1) some air were inside the bags, which affects the speed of osmosis; 2) friction on the dialysis bag may have affected the pores of the bags, which will affect diffusion; 3) measuring errors on the cup with 0.0 M of sucrose solution might explain why there was a change in mass.
